This method provides the optimal grouping of available data by automatic choosing number of clusters. Advantages of this method include possibility to work with both continuous and categorical variables; furthermore, it handles well big amounts of data and provides simple visual methods to assess results.
Two-step clustering got its name due to clustering procedure which includs two steps:
Step 1 constructs Cluster Features (CF) Tree, which begins by placing the first case at the root of the tree in a leaf node that contains variable information about that case. After this, each next case is then added to an existing node or forms a new node, depending on its similarity with existing nodes. As a similarity criterion one of two distance measures are used – log-likelihood or Euclidian. This step finishes with formation of a ‘tree’ with nodes containing summary of variable information about included in each node cases.
Step 2, using agglomerative clustering algorithm, groups leaves of the CF tree. It can produce range of solutions for grouping and the best solution is chosen by either of two methods – Schwarz's Bayesian Criterion or the Akaike Information Criterion.
We shall discuss application of cluster analysis on a simple example which shows well all features of this method. Activity of 42 antibiotics was measured against different bacterial strains by the disk diffusion method. Preliminary processing of results included calculating percentage of sensitive strains to antibiotics depending on a genus of tested bacteria. Finally, preliminary results of this study were represented in a table with number of sensitive strains to each antibiotic for five bacterial genera (or species) – Enterococcus, E. coli, Staphylococcus, Streptococcus and other (see Example 7).
The research question which will be answered by application of cluster analysis is objective classification of antibiotics depending on their activity against studied bacteria. This can be done by any method of clustering – two-step, k-means and hierarchical clustering.
Specifying two-step cluster analysis
1) Click the Analyze menu, point to Classify, and select Two-Step Cluster… :
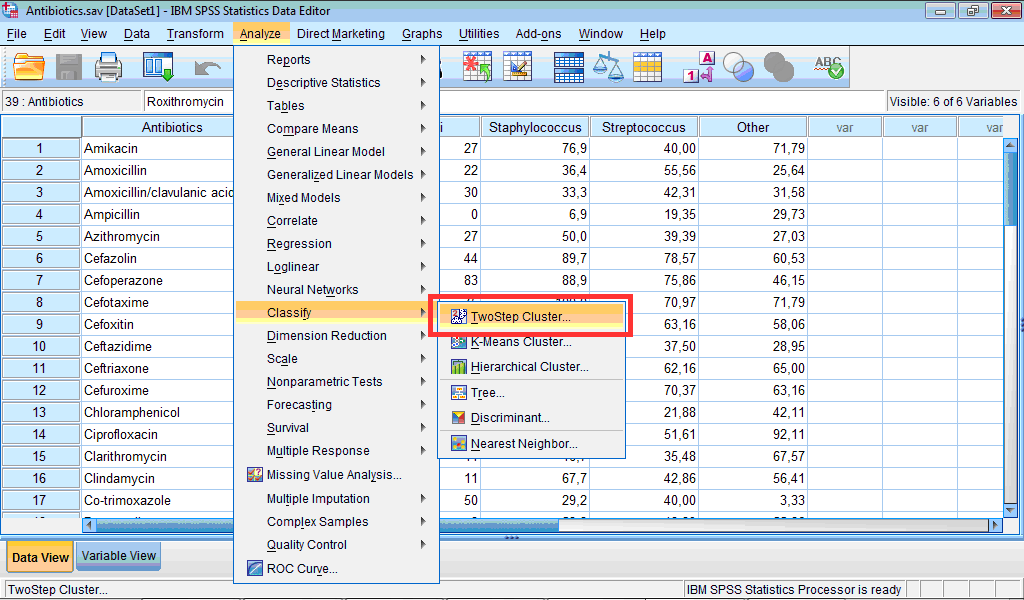
The TwoStep Cluster Analysis dialog box opens:
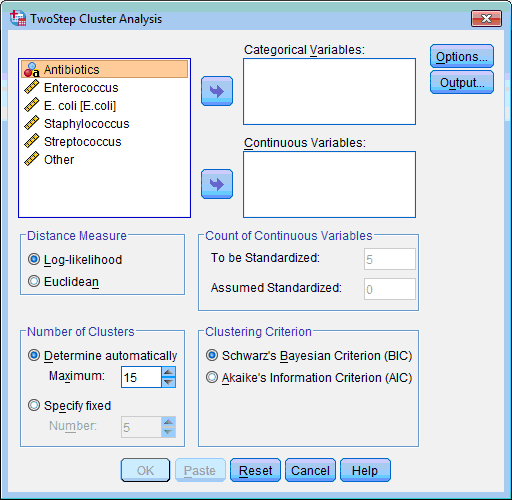
2) Select the variables on which classification of objects will be based (“Enterococcus”, “E. coli”, “Staphylococcus”, “Streptococcus”, “Other”); click the lower transfer arrow button  . The selected variables are moved to the Continuous Variable(s): list box.
3) Click the Output… button. The TwoStep Cluster: Output dialog box opens:
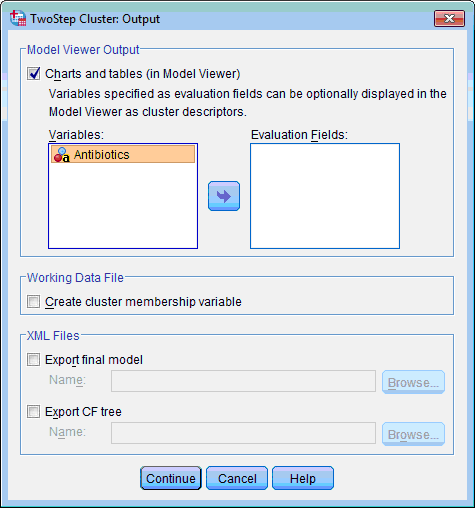
4) In the Model Viewer Output section leave selected by default the Charts and Tables (in Model Viewer) check box.
5) In the Working Data File section select the Create Cluster Membership Variable check box. This will create additional variable in data file which will show membership of each case in produced clusters:
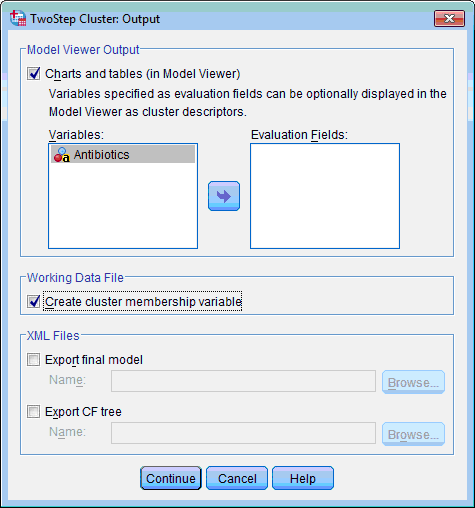
6) Click the Continue button. This returns you to the TwoStep Cluster Analysis dialog box.
7) All other options can be left with default values. Click the OK button. An Output Viewer window opens and displays the results.
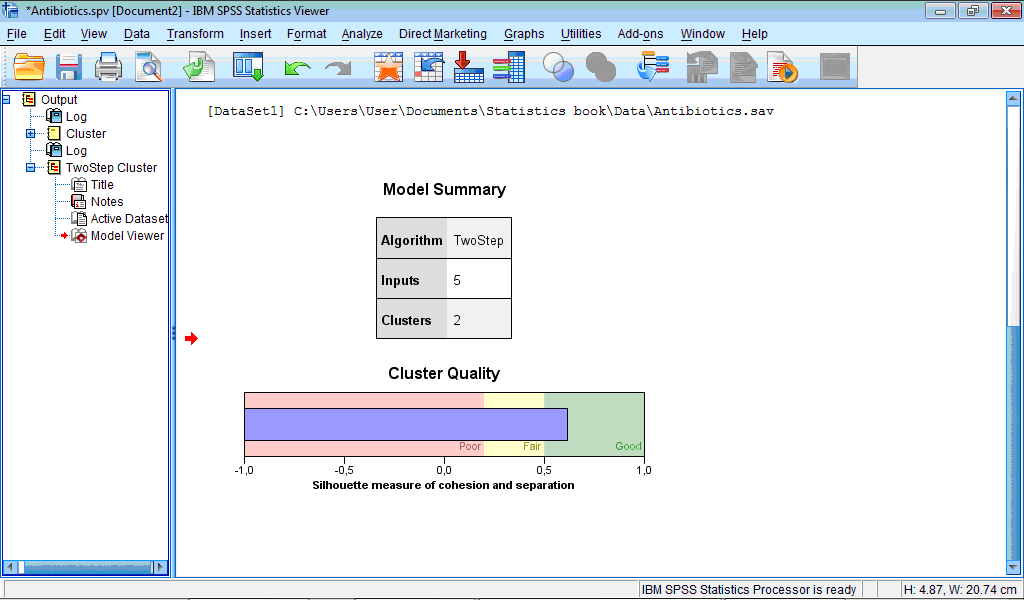
The Output Viewer window contains the Model Viewer set of charts which by default shows only two charts – Model Summary and Cluster Quality:
However double-clicking on any of charts opens another Model Viewer window with all other results.
The Model Summary chart shows that classification produced 2 clusters.
The Cluster Quality chart assesses obtained classification. In our example quality is “Good” – the central (blue) bar reached right (green) section corresponding to good quality. If to activate Model Viewer by double-clicking on this chart and then place pointer on it, it will be shown that average cluster quality (“Average Silhouette”) is 0.6 from 1 maximally possible, which is rather good quality.
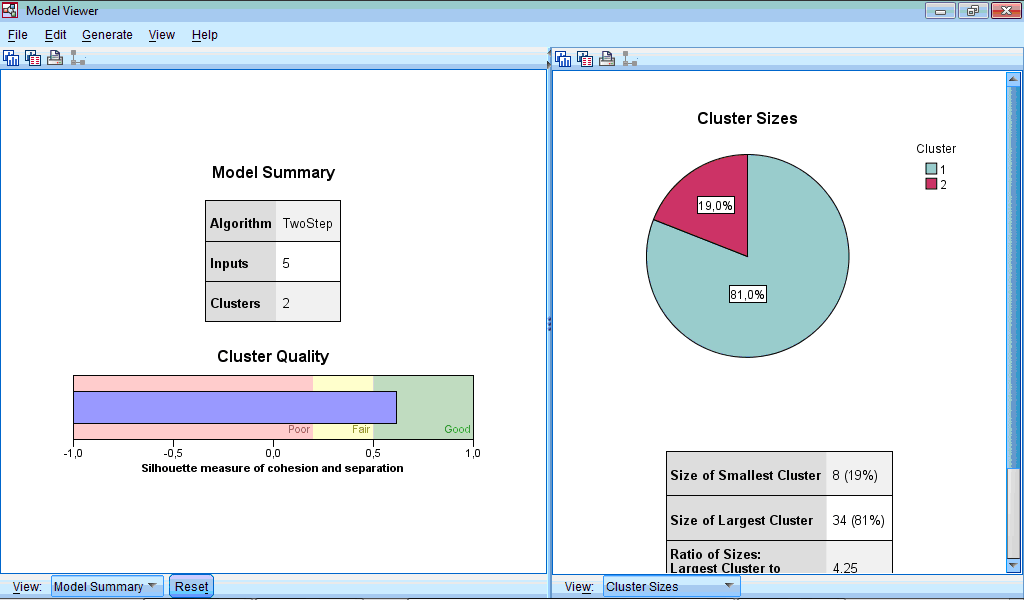
The Model Viewer window consists of two parts – left part contains model summary and general information about clusters, while right part contains more detail information about clusters and importance of predictors during classification:
Let us select the Clusters option from dropdown menu of left part of Model Viewer:
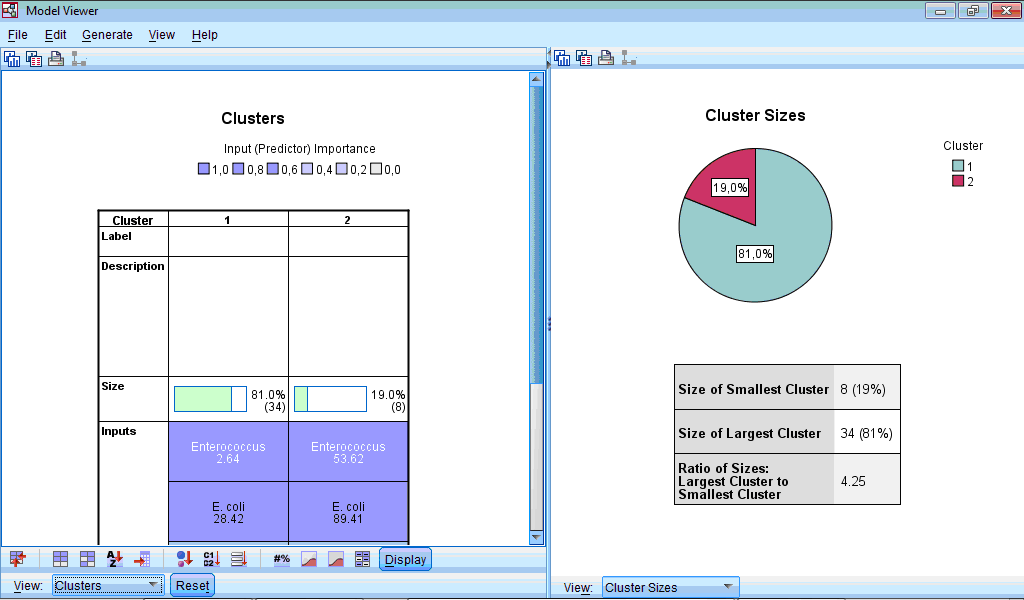
At lower part of the window panel with buttons appeared. And also we can see chart shown by default – characterization of clusters by importance of input variables. This chart can be also produced by clicking the button  in the lower menu (during location of pointer on this button “Sort inputs by overall importance” hint appears). By default, clusters are sorted from left to right by cluster size, so cluster 1 includes 34 observations (81%) and cluster 2 – 8 (19%). From this chart we can see that the highest impact on classification was made by the variable “Enterococcus”, the lowest – by the variables “Other” and “Staphylococcus” (this is seen by scrolling down the side bar). We can also see mean values for all variables in each cluster, for example, number of sensitive strains of enterococci to antibiotics in the first cluster was 2.64%, while in the second cluster – 53.62%. Looking at all other bacteria we can also notice that antibiotics of second cluster demonstrated higher activity.
Button  provides sorting of clusters by within-cluster importance, button
  - by names, button
  - by data order. Several next buttons provide sorting of clusters by size, by name and by label, and some other classifications. Important information is displayed after clicking
  and
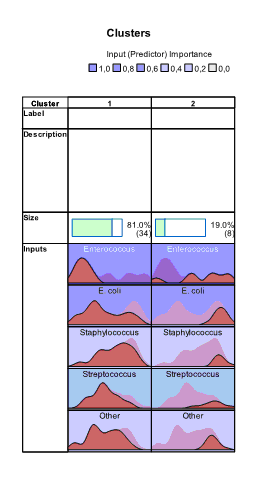
and  buttons. Charts appear which show absolute and relative distribution of values of variables in each cluster. From these charts we can see that all variables have different distributions of values in clusters:
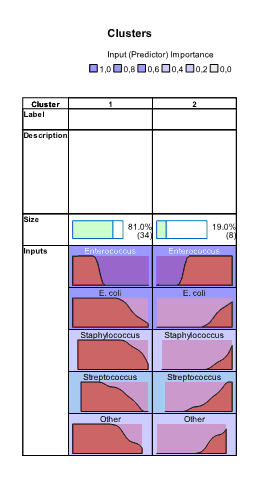
In the right part of the Model Viewer by default Cluster Sizes chart is shown:
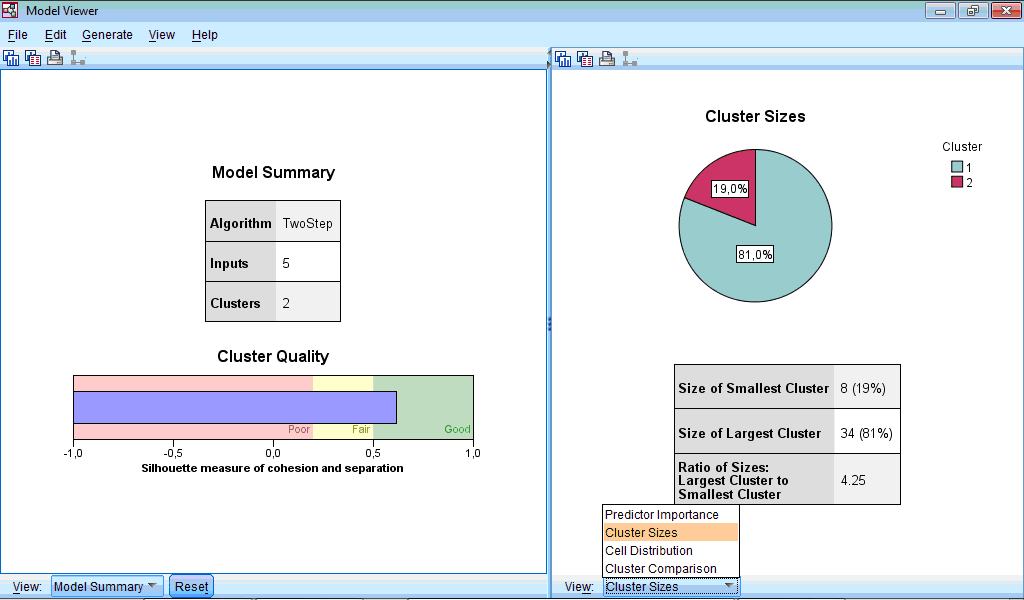
By clicking dropdown menu we can choose display of Predictor Importance chart, and also Cell Distribution and Cluster Comparison charts; however, last two options are not available for our data.
The Cluster Sizes chart is a pie-diagram demonstrating sizes of clusters; at this section there is also information about ratio between cluster sizes (4.25 in our example).
The Predictor Importance chart graphically demonstrates importance of variables in classification. Here we also can see the highest impact of variable “Enterococcus” and lowest – of “Staphylococcus”. All above mentioned charts and information from them can be copied as visualization itself, as visualization data or printed by clicking the buttons  ,
,  and
and  , respectively, in upper part of Model Viewer window.
Finally, it is important to know which observation fall in which cluster. For this purpose during specification of two-step clustering we have selected the Create Cluster Membership Variable check box in the TwoStep Cluster: Output dialog box (see above). Let us open the Data Editor window. We see that new variable “TSC_2363” was created which contains information about membership of each case:
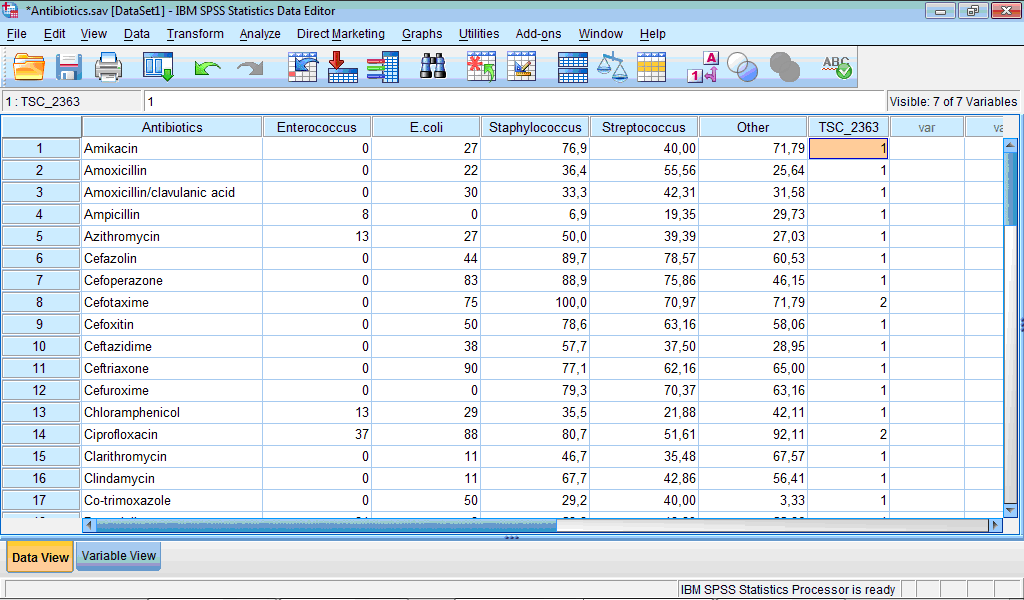
Analysing cluster membership of cases we can determine antibiotics which belong to the more active cluster (Cluster 2): cefotaxime, ciprofloxacin, furagin, gatifloxacin, gentamicin, imipenem, levofloxacin, and meropenem.

